Data visualization plays an important role in helping organizations understand information, identify trends, and make informed decisions. However, creating an effective dashboard requires more than selecting charts and arranging them on a screen.
It involves understanding the underlying data, preparing it correctly, applying appropriate calculations, choosing meaningful visualizations, and presenting information in a way that supports analysis and decision-making.
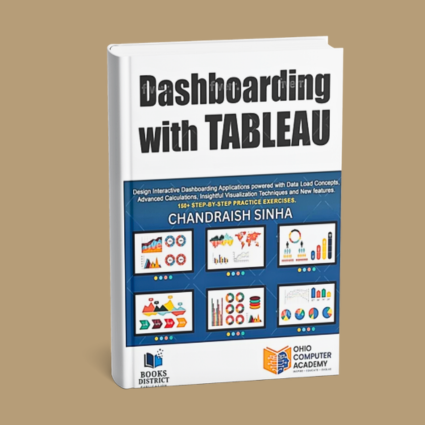
Dashboarding with Tableau is a comprehensive, hands-on guide that takes readers through the process of working with data in Tableau Desktop, from fundamental concepts to advanced calculations and interactive dashboard development.
With more than 150 step-by-step exercises, downloadable code files, and color illustrations, the book provides a structured approach to learning Tableau through practical application.
Whether you are beginning your journey in business intelligence or looking to deepen your Tableau skills, this book offers the concepts, techniques, and exercises needed to develop effective data visualization solutions.
Why I Wrote This Book
Throughout my work in technology education and data analytics training, I have observed that learning a visualization tool and understanding how to communicate insights through data are two different skills.
It is relatively easy to learn how to create a chart. The greater challenge is understanding which data to use, how to prepare it, what calculations are needed, and how to present the results in a meaningful way.
A dashboard may look visually appealing, but its real value comes from the questions it helps answer.
I wanted to write a book that would approach Tableau as more than a visualization tool.
My objective was to guide readers through the complete process of working with data, beginning with data loading and transformation, progressing through relationships, joins, calculations, and visualization techniques, and ultimately bringing these elements together in interactive dashboards.
I also wanted readers to learn by doing.
That is why the book includes more than 150 step-by-step exercises, allowing readers to follow along, experiment with Tableau features, and gradually develop confidence in applying the concepts independently.
Rather than focusing only on individual features, I wanted to demonstrate how those features work together to support meaningful data analysis.
This book reflects my belief that effective dashboard development begins with understanding the data and ends with communicating its insights clearly.
What You’ll Learn
The book follows a progressive learning approach, beginning with Tableau fundamentals and advancing toward more sophisticated data analysis and dashboarding techniques.
What Makes This Book Practical?
The central approach of Dashboarding with Tableau is to combine conceptual understanding with hands-on experience.
Instead of simply describing Tableau features, the book demonstrates how they can be used through guided examples and exercises.
Readers will find:
- 150+ step-by-step exercises designed to reinforce learning through practice.
- Comprehensive coverage of Tableau Desktop, from foundational concepts to advanced techniques.
- Practical explanations of data loading, transformation, relationships, and joins.
- Detailed coverage of calculations, functions, table calculations, and LOD expressions.
- Exercises involving different visualization techniques and dashboard development.
- Downloadable code files and color illustrations to support the learning experience.
- Coverage of features introduced in Tableau 2023.1.
The book is structured to help readers build their skills progressively, allowing them to understand individual concepts before combining them into more complete analytical solutions.
Who Should Read This Book?
Dashboarding with Tableau is intended for readers who want to develop practical skills in data visualization, business intelligence, and dashboard development.
It may be particularly useful for:
- Aspiring Tableau developers seeking a structured introduction to the platform.
- Business intelligence analysts who want to strengthen their visualization and dashboarding skills.
- Data analysts looking to explore and communicate insights more effectively.
- Business professionals who work with reports, metrics, and performance information.
- Students preparing for careers in data analytics or business intelligence.
- Data enthusiasts interested in transforming raw information into interactive visualizations.
- IT professionals seeking to expand their knowledge of Tableau Desktop.
No prior Tableau experience is required. Basic familiarity with Microsoft Excel can be helpful.
A Final Thought
An effective dashboard is not defined by the number of charts it contains or the complexity of its calculations.
Its value lies in how clearly it communicates information and how effectively it helps people understand what the data is telling them.
Building that kind of dashboard requires a combination of technical knowledge, analytical thinking, and thoughtful design.
My hope is that this book helps readers develop all three by moving beyond individual Tableau features and understanding how data preparation, calculations, visualizations, and interactivity come together.
A good dashboard displays information. A meaningful dashboard helps people understand it.