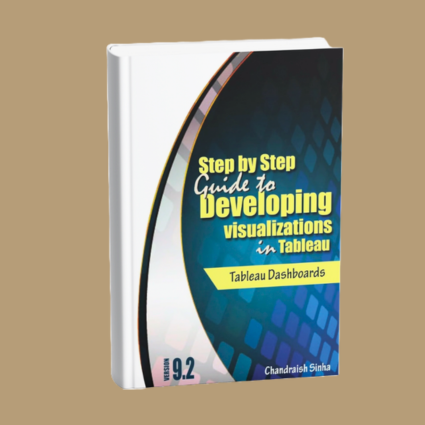
Data visualization plays an important role in transforming information into meaningful insights. While individual charts help us understand specific aspects of data, dashboards bring multiple visualizations together to provide a broader analytical perspective.
Tableau enables users to explore data, create visualizations, and develop dashboards that communicate information in an accessible and interactive format.
Tableau Dashboards is a hands-on guide designed to help readers understand Tableau concepts and apply them to dashboard development.
The book provides step-by-step guidance using three data sources and includes more than 20 sample dashboards to support practical learning.
Rather than focusing exclusively on theoretical explanations, it encourages readers to work directly with data, develop visualizations, and understand how different analytical views can be brought together.
The book also serves as a resource for readers who want to revisit Tableau fundamentals and strengthen their existing knowledge.
Based on Tableau 9.2, it provides an introduction to dashboard development using the capabilities available in that version.
Whether you are beginning your Tableau journey or looking to refresh your visualization skills, this book offers a practical approach to learning through examples and exercises.
Why I Wrote This Book
Throughout my experience in technology education and data analytics training, I have observed that one of the most effective ways to learn a visualization tool is to work on practical examples.
Understanding how to create an individual chart is important, but developing a dashboard requires bringing different visualizations together to communicate information more effectively.
For beginners, this process can sometimes appear complicated.
They may understand basic Tableau concepts but remain uncertain about how to apply them when developing a complete dashboard.
I wanted to create a book that would make this process easier to follow through structured, step-by-step guidance.
My objective was to help readers move beyond learning individual Tableau features and gain practical experience in developing visualizations and dashboards.
That is why I organized the material around three data sources and included more than 20 sample dashboards.
By working through different examples, readers can explore how Tableau concepts are applied in practical situations.
I also wanted the book to serve as a useful refresher for individuals who had previously worked with Tableau but wanted to revisit important concepts through hands-on practice.
My goal was to provide an accessible resource that encourages readers to learn by doing and develop greater confidence in creating Tableau dashboards.
What You’ll Learn
The book introduces Tableau concepts through practical exercises focused on visualization and dashboard development.
What Makes This Book Practical?
The distinguishing feature of Tableau Dashboards is its emphasis on learning dashboard development through hands-on examples.
Rather than requiring readers to study Tableau concepts only through written explanations, the book encourages them to apply those concepts while working with data.
Readers will find:
- Step-by-step guidance for developing Tableau dashboards.
- Practical exercises using three data sources.
- More than 20 sample dashboards.
- Examples designed to reinforce Tableau concepts.
- Opportunities to practice creating visualizations.
- Sample workbooks that support independent learning.
- Download instructions for accessing the accompanying data sources and workbooks.
- A structured approach suitable for beginners and readers refreshing their Tableau knowledge.
The exercise-based format allows readers to follow examples, explore completed dashboards, and develop their understanding through practical experience.
Learning Dashboard Development Through Examples
Creating a dashboard involves more than placing charts together on a screen.
A useful dashboard should help readers understand information by presenting relevant visualizations in a clear and organized manner.
Learning how to develop dashboards requires practice with data and an understanding of how different analytical views contribute to the overall presentation.
This book approaches dashboard development through practical examples.
By working with three data sources and exploring more than 20 sample dashboards, readers can gain experience in applying Tableau concepts to different visualization tasks.
The examples are intended to encourage experimentation and help readers develop the confidence to create their own dashboards.
Who Should Read This Book?
Tableau Dashboards is intended for readers who want to learn or strengthen their Tableau visualization and dashboard development skills.
It may be particularly useful for:
- Beginners who want to start learning Tableau.
- Students exploring data visualization and business intelligence.
- Data analysts interested in creating dashboards.
- Business professionals who want to present information visually.
- IT professionals exploring Tableau’s analytical capabilities.
- Tableau users who want to refresh their understanding of fundamental concepts.
- Individuals who prefer learning through practical examples and exercises.
The book is designed to support readers who are new to Tableau as well as those looking to revisit important concepts through hands-on practice.
Version note: This book was developed for Tableau 9.2. Many fundamental visualization and dashboard concepts remain useful, although readers working with newer Tableau versions may encounter differences in the interface and available functionality.
Sample Dashboards and Practice Resources
The book includes more than 20 sample dashboards developed using three data sources.
These examples were designed to support the step-by-step exercises and provide readers with practical references as they work through the material.
Instructions for downloading the data sources and sample workbooks are provided in the book.
Readers can use these resources to follow the exercises, examine completed examples, and reinforce their understanding of Tableau dashboard development.
Resource availability may have changed since publication. Readers should verify that the referenced downloads remain accessible.
A Final Thought
Learning data visualization is not simply about understanding how to create individual charts.
It is about developing the ability to bring information together in a way that makes patterns, comparisons, and insights easier to understand.
Dashboards provide an opportunity to combine different analytical perspectives into a more complete view of information.
For beginners, the most effective way to develop these skills is through consistent practice and experimentation.
My hope is that this book helps readers take their first steps in Tableau dashboard development while encouraging them to continue exploring the possibilities of data visualization.
A meaningful dashboard does more than display data. It helps people understand the information behind it.